Monitoring & Alerting
System monitoring and alerting configuration for platform reliability.
This section covers monitoring setup, alert configuration, performance metrics, and observability tools for maintaining platform health.
Architecture
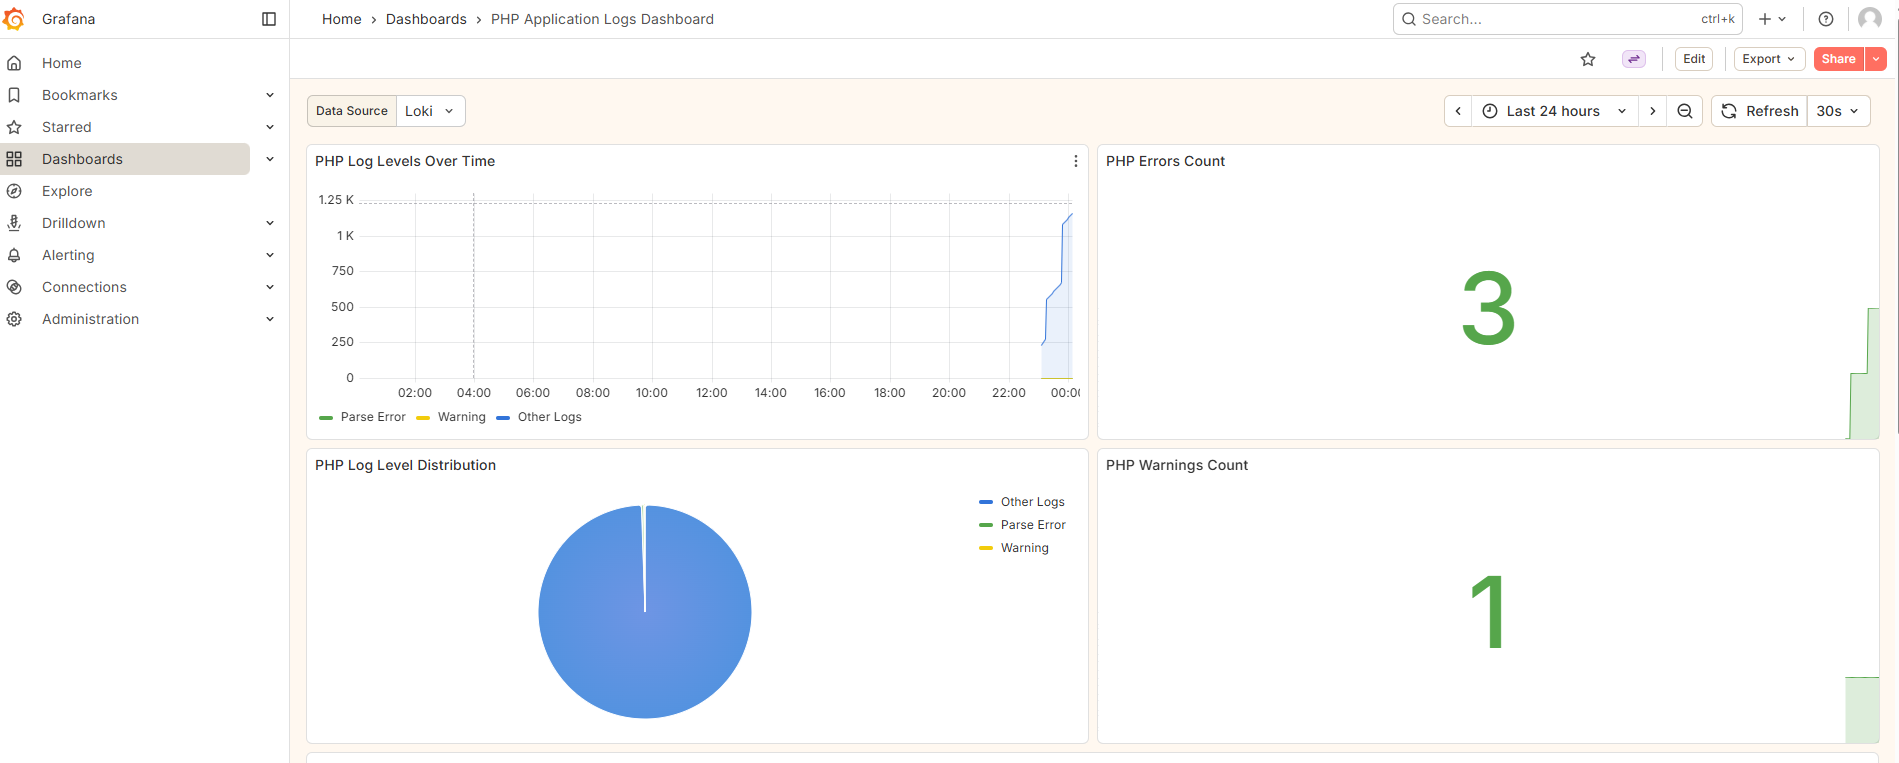 Figure 1: Grafana logs interface provides powerful search and filtering capabilities for application debugging
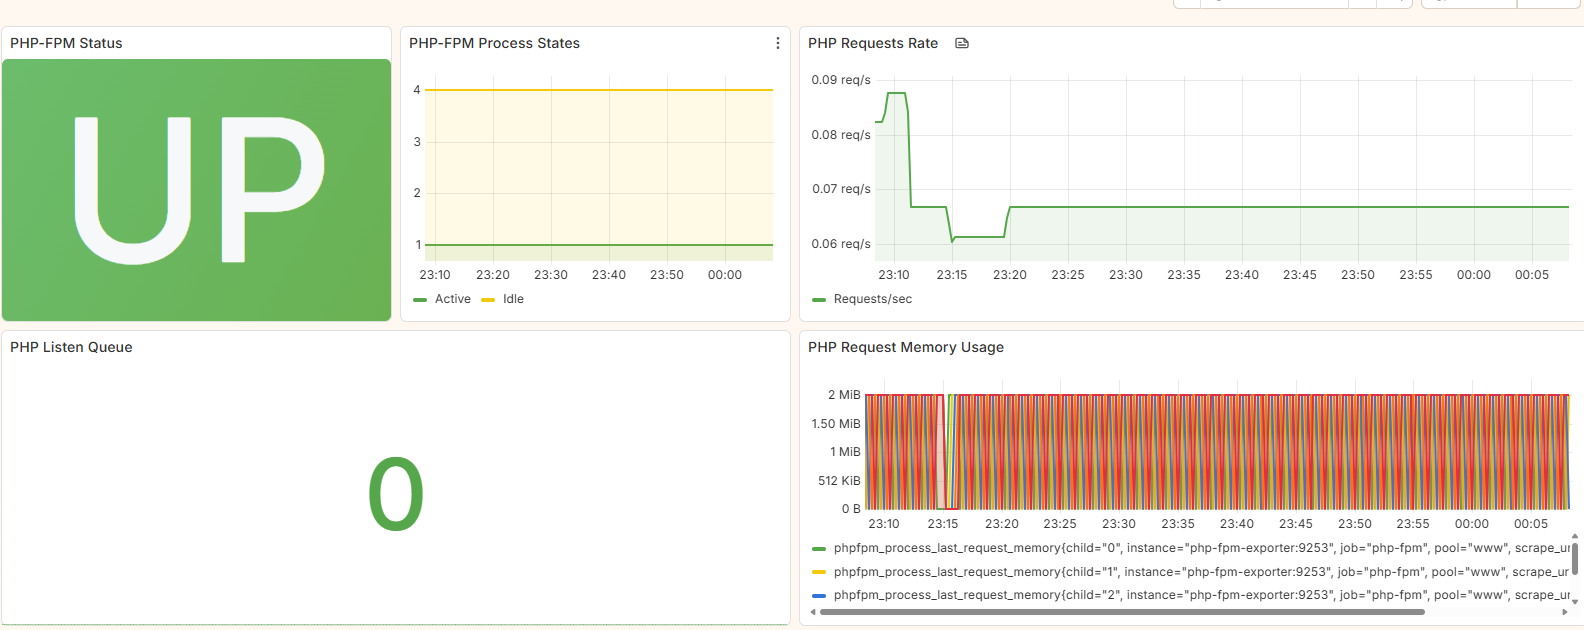 Figure 2: PHP-FPM monitoring dashboard shows process health, request handling, and performance trends
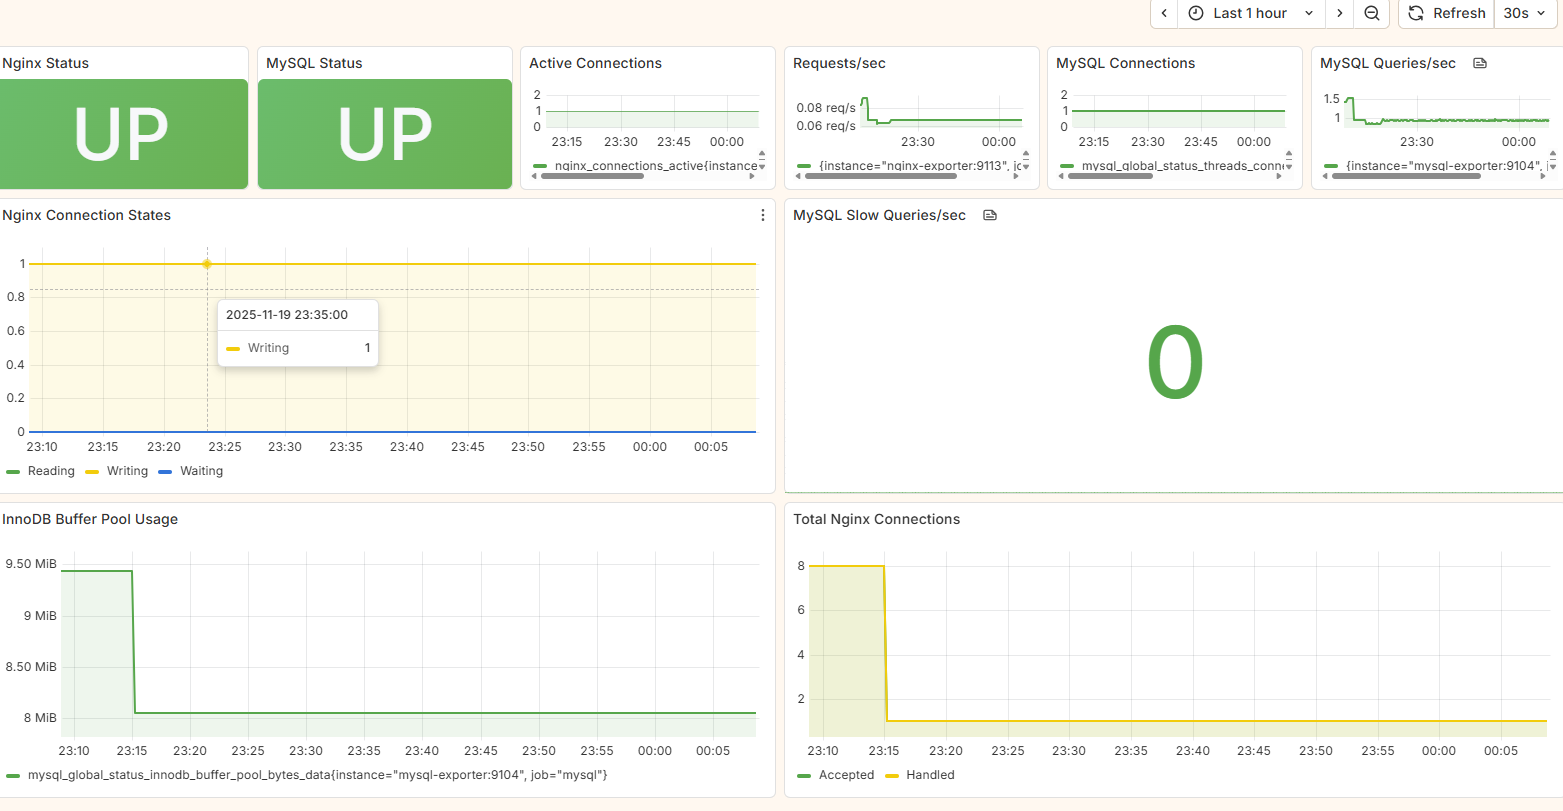 Figure 3: Combined infrastructure monitoring view displays database performance alongside web server metrics
Data Flow
Metrics Flow
- Exporters scrape metrics from applications
- Prometheus collects and stores metrics
- Grafana visualizes metrics and defines alert rules
- AlertManager handles alert routing and notifications
Logs Flow
- Applications write logs to files
- Promtail tails log files and ships to Loki
- Loki indexes and stores logs
- Grafana provides log search and analysis capabilities
Monitoring Targets
Application Metrics
PHP-FPM Metrics
- Process Management: Active processes, idle processes, total processes
- Performance: Request duration, slow requests, request queue
- Memory Usage: Memory consumption per process
- Status Codes: Response status distribution
Nginx Metrics
- Request Volume: Total requests, requests per second
- Response Times: Average, p95, p99 response times
- Status Codes: 2xx, 3xx, 4xx, 5xx distribution
- Connections: Active, reading, writing, waiting connections
MySQL Metrics
- Connections: Active, max, aborted connections
- Query Performance: Queries per second, slow queries
- Resource Usage: CPU, memory, disk I/O
- Replication Status: Master/slave synchronization (if applicable)
Log Monitoring
PHP-FPM Logs
- Error Logs: PHP Parse errors, Fatal errors, Warnings
- Access Logs: Request logging with response codes and timing
- Slow Logs: Slow request identification and analysis
ThinkPHP Application Logs
- Business Logic Errors: Application-specific errors and exceptions
- SQL Errors: Database query failures and performance issues
- Authentication Events: Login attempts, authorization failures
- API Usage: Request/response logging for debugging
Nginx Logs
- Access Patterns: Request patterns, popular endpoints
- Error Conditions: 4xx, 5xx error analysis
- Security Events: Suspicious request patterns, potential attacks
Key Performance Indicators (KPIs)
Infrastructure KPIs
- CPU Utilization: < 80% average
- Memory Usage: < 85% of allocated memory
- Disk I/O: < 90% capacity
- Network Throughput: Monitor bandwidth usage
Application KPIs
- Response Time: < 500ms average, < 2s p95
- Error Rate: < 1% of total requests
- Uptime: > 99.9%
- Concurrent Users: Track peak usage patterns
Database KPIs
- Query Performance: < 100ms average query time
- Connection Usage: < 80% of max connections
- Slow Query Rate: < 0.1% of total queries
- Database Size: Monitor growth trends
Maintenance and Operations
Backup Strategy
- Configuration Backup: Version control all configuration files
- Data Backup: Regular backups of Prometheus and Loki data
- Dashboard Backup: Export Grafana dashboards and data sources
- Recovery Testing: Regular disaster recovery testing
Scaling Considerations
- Prometheus: Federation or remote write for large-scale deployments
- Loki: Distributed deployment for high-volume log ingestion
- Grafana: Load balancing for high-availability deployments
- Storage: Plan for storage growth trends
Regular Tasks
- Daily: Check alert status, review resource utilization
- Weekly: Update dashboards, review alert rules
- Monthly: Performance tuning, capacity planning
- Quarterly: Security audits, backup verification
Troubleshooting Guide
Common Issues
Service Unavailable
- Check: Docker container status, resource usage
- Verify: Network connectivity, port availability
- Solution: Restart services, check configuration
Missing Metrics
- Check: Exporter status, network connectivity
- Verify: Prometheus scrape targets, configuration
- Solution: Restart exporters, update Prometheus config
Log Ingestion Issues
- Check: Promtail status, log file permissions
- Verify: Loki ingestion endpoint, disk space
- Solution: Restart Promtail, check log file paths
Dashboard Errors
- Check: Data source connections, query syntax
- Verify: Time range settings, user permissions
- Solution: Update data sources, fix query syntax
Conclusion
This monitoring and alerting design provides comprehensive visibility into the LNMP stack, enabling proactive issue detection, rapid troubleshooting, and data-driven decision making. The combination of metrics and logs monitoring ensures complete observability across all system components.
Regular review and updates of this monitoring strategy will ensure continued effectiveness as the system evolves and grows.